But without reporting, how do stakeholders actually know that the new process is delivering the expected outcome and that important data is not being lost somewhere along the way?
This becomes especially important when one business process runs across several systems. A customer journey might begin on a website, create a lead in a CRM, move into a quoting tool, continue through an operational system and eventually reach an ERP or finance platform.
Website → CRM → Quoting → Operational System → ERP / Finance
Each individual system may be working correctly. Each individual report may also be correct. The problem becomes visible when we compare what happened to the same business process across all of them.
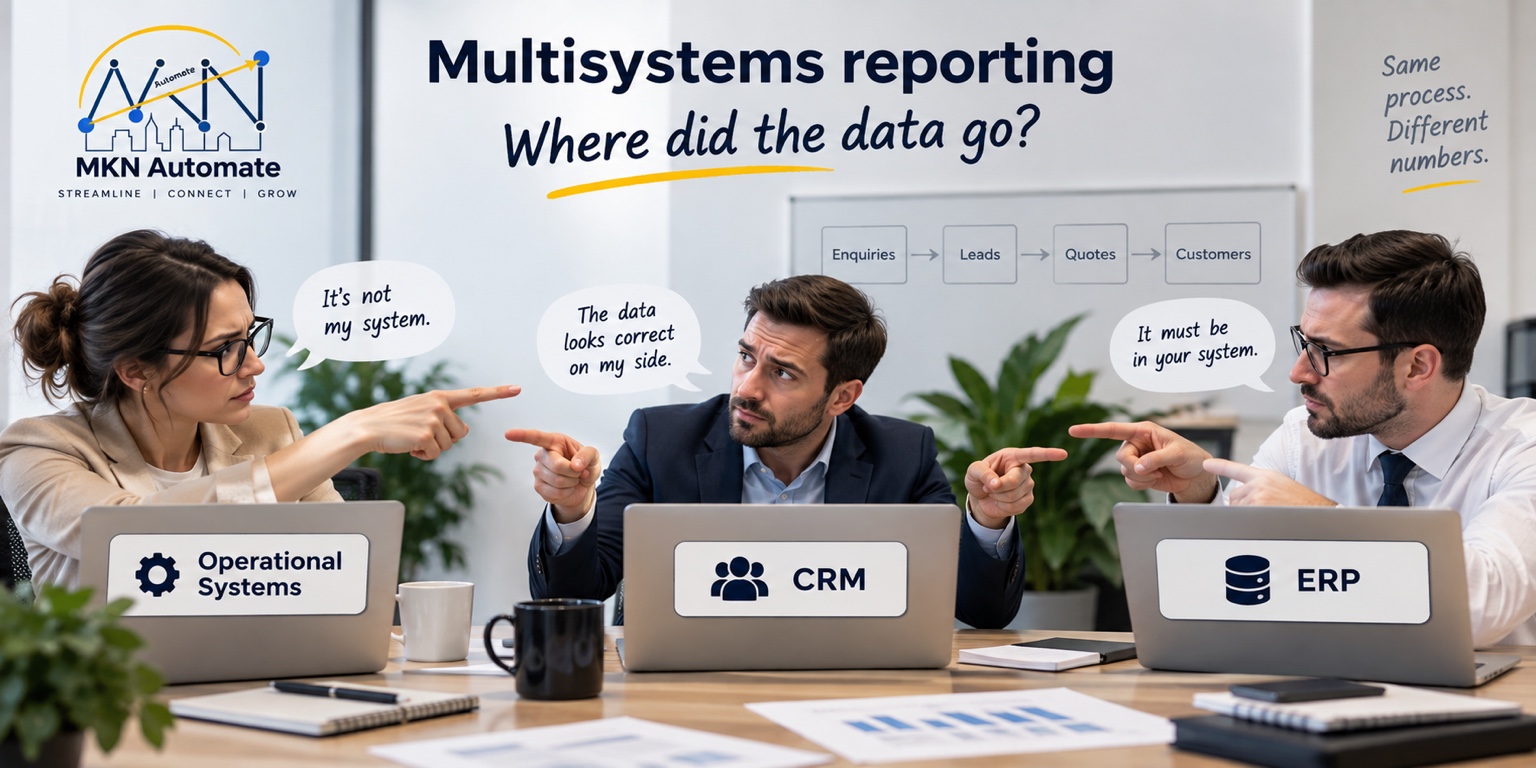
Why Management Reporting Fails Across Multiple Systems
Consider a simple customer process. The website reports 100 enquiries. The CRM contains 94 leads. The quoting system contains 81 quotes. Finance eventually contains 27 converted customers.
Website: 100 enquiries → CRM: 94 leads → Quoting: 81 quotes → Finance: 27 customers
Those differences do not automatically mean that customers have been lost. Some people may have cancelled, decided not to proceed or been disqualified for a valid business reason. The numbers need context before anybody draws a conclusion.
There may also be a system or process issue. An integration could have failed. An enquiry might never have created a CRM record. A status may not have been updated. Duplicate records may be counted differently, or two systems may use different definitions for the same stage. A valid lead may simply never have received a quote.
This is why reporting accuracy cannot be assessed by looking at one total in isolation. Every individual report may technically be correct while the complete business picture is still incomplete.
Good management reporting needs to show both the totals and the movement between them. That is the point at which reporting becomes useful for understanding the process rather than merely describing one system.
What Cross-System Reporting Can Reveal
Useful cross-system reporting allows a stakeholder to investigate the records behind the totals. If the website received 100 enquiries but the CRM contains only 94 leads, the report should help identify which six enquiries did not reach the expected next stage.
The same approach can be used to ask practical operational questions:
- Which website enquiries never became CRM leads?
- Which leads never received a quote?
- Which quotes exist in the quoting system but have no corresponding order?
- Which operational transactions are missing from finance?
- Which records have different statuses across systems?
- Which integrations are producing exceptions?
- Which records have been sitting between stages for too long?
A dashboard that says “13 records are missing” is a useful alert. A dashboard that lets the user identify which 13 records require investigation is much more useful.
That is the distinction between observing a KPI and using reporting as an investigation tool. The first shows that something has happened. The second gives somebody enough information to understand the issue and take action.
How Data Integration Improves Reporting Accuracy
Different systems rarely describe the same transaction in exactly the same way. One platform may use a customer ID, another an enquiry ID, and another an order number. Status names, dates, financial transactions and operational events may also be stored in different structures.
For reporting across multiple systems to work, the relevant data needs to be connected, matched and interpreted using consistent business rules. That does not begin with a database design. It begins with understanding the business process.
We need to know which systems are involved, how the same transaction can be recognised in each one, what the different statuses actually mean, what should happen at every stage and what represents a genuine exception.
For example, “Complete” in an operational system may mean that the work has finished, while “Complete” in finance may mean that the invoice has been posted. Treating those statuses as identical could create a misleading report even when both source systems are correct.
This is where Business Analysis matters. The technical connection brings the data together, but the process and business rules determine whether the comparison is meaningful.
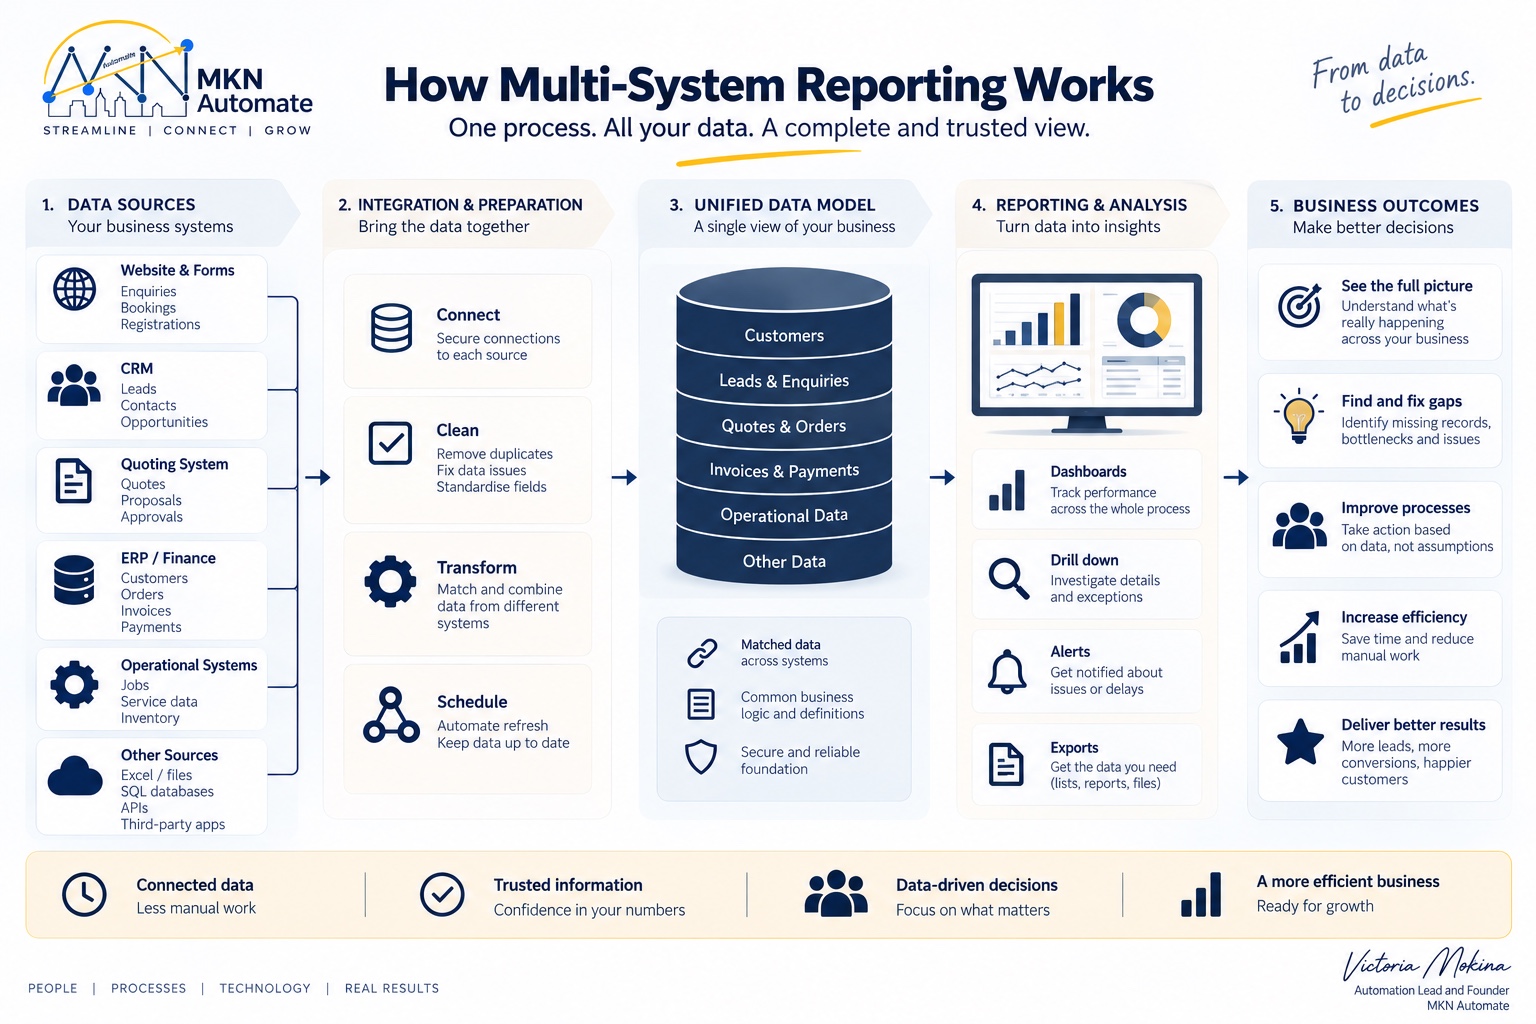
At a high level, multi-system reporting works by bringing the relevant data together, applying consistent business rules and creating a reporting layer from which the process can be monitored and investigated.
Manual Reconciliation vs Reporting Automation
The common alternative is manual reconciliation. People export data from several systems into Excel, compare totals, search for missing IDs and repeat the same checks every week or month.
This can be entirely reasonable at small volumes. A simple spreadsheet may be the most proportionate solution when there are few transactions, limited risk and little value in building something more sophisticated.
As transaction volumes increase, however, the work becomes time-consuming and exceptions are harder to identify quickly. Different people may apply slightly different rules, extracts may cover different periods, and the reconciliation can become dependent on somebody remembering every step.
Reporting automation can refresh the data, apply the same reconciliation rules consistently, flag exceptions, highlight missing records and monitor operational reporting KPIs without requiring the full comparison to be rebuilt each time.
The right level of automation still depends on the business problem, transaction volume and value of the information. The aim is not to introduce a complex reporting platform where a simple method is sufficient. It is to reduce repeated manual checking where the effort and risk justify it.
When Power BI Reporting Is the Right Choice
Power BI reporting can be a good option when a business needs to combine information from multiple data sources, monitor KPIs, compare systems, identify exceptions and drill into underlying records through interactive reporting dashboards.
It is one possible reporting technology, not the starting point for every solution. Other approaches may be more appropriate depending on the systems involved, existing licences, data volumes, refresh requirements and the people who need to use the information.
The most important decisions happen before choosing the reporting tool:
- What does the business need to know?
- What needs to be compared?
- Which exceptions need investigation?
- What action should somebody take when the report identifies a problem?
Once those questions are clear, it becomes much easier to decide whether Power BI, an existing system report, a spreadsheet or another reporting approach is the right fit. The wider MKN Automate solutions follow the same principle: understand the process first, then select technology that supports it.
AI Cannot Investigate Data It Cannot See
Modern AI and business intelligence tools increasingly allow users to ask questions about business data in natural language. A stakeholder might reasonably ask, “Why are 30 customers missing?”
If the information needed to answer that question is spread across several systems and has not been connected or matched, AI does not have the evidence required to investigate it properly. It cannot analyse data that has never been made available to the reporting environment.
The reporting and data foundation therefore comes first. Once the relevant information is available, correctly structured and understood in business terms, AI can become another useful way to explore it. It does not replace the need for reliable data integration and clear reporting logic.
What a Multi-System Reporting Solution Should Include
There is no universal dashboard for reporting across multiple systems. Good reporting starts with the process and the decisions people need to make.
Before designing the report, I would work through what starts the process, which systems the information passes through and what should happen at each stage. We also need to understand how the same record can be matched between systems, what each status means and which exceptions genuinely matter to the business.
From there, we can decide what stakeholders should be alerted to, what information they need to investigate a problem and what success actually looks like. A finance team may need data reconciliation between operational and financial records. A sales manager may need visibility from enquiry through to quote and conversion. An operations team may need to see delays between an accepted order and the work being scheduled.
Reporting should be designed backwards from the business questions, not forwards from whatever data happens to be easiest to extract.
This keeps the reporting focused on the end-to-end outcome instead of producing another dashboard that is technically impressive but difficult to use.
How to Start Improving Business Reporting
A project is not successful simply because a system went live. An integration is not successful simply because it can technically transfer data. The business expected an outcome, and reporting should help confirm whether that outcome is happening.
Customer enquiries should be answered. Quotes should reach customers. Orders should reach operations. Transactions should reach finance. Approvals should be completed.
The starting point is to map the end-to-end process and identify the questions that stakeholders cannot currently answer. Then compare the records that should exist at each stage, agree consistent definitions and focus first on the gaps that create the greatest operational or financial impact.
Good management reporting gives stakeholders visibility over whether the complete process is working. It also gives them a practical way to investigate when it is not.
When the numbers don't match, the most useful question isn't only “How many?”
It's: “Where did the data go?”